Suggested
News
Last updated: Friday, April 11, 2025

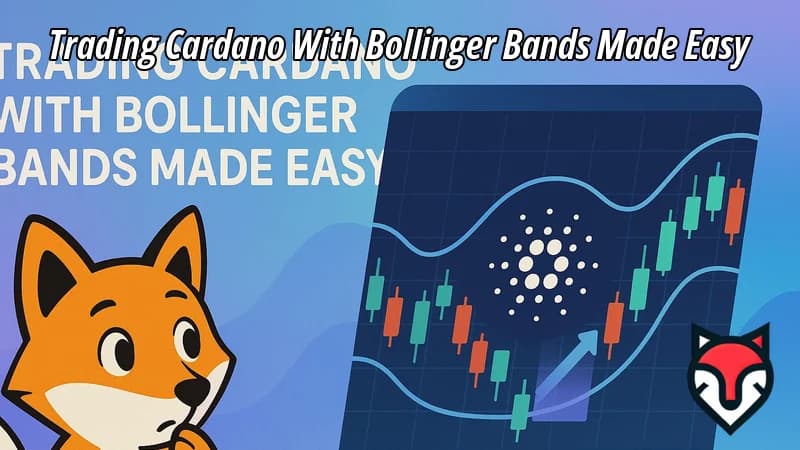
Trading Cardano with Bollinger Bands Made Easy: Your 2025 Guide to ADA Profits
It’s April 10, 2025, and Cardano’s ADA is holding steady at $0.75, with whispers of a $1 breakout on the horizon. Want to trade it like a pro? Bollinger Bands are your ticket. This simple yet powerful tool can spot Cardano’s price swings, whether you’re in Seoul or São Paulo. No PhD in charts needed—trading Cardano with Bollinger Bands is about timing buys and sells with precision. In this guide, we’ll break down how to use Bollinger Bands for ADA, step-by-step, with setups, strategies, and tips to boost your 2025 crypto game.
What Are Bollinger Bands and Why Cardano?
Bollinger Bands are a trader’s best friend—three lines on a chart: a middle moving average (usually 20-day) and two bands (standard deviations) above and below. They widen when Cardano’s volatile, shrink when it’s calm. Think of them as a price fence—ADA hits the upper band, it’s overbought; lower band, oversold. Simple, right?
Why Cardano? In 2025, ADA’s a mid-cap star—$30 billion market cap, eco-friendly blockchain, and staking at 5% APY. It’s less wild than memecoins but punchier than Bitcoin. Bollinger Bands love its steady swings—perfect for catching $0.70 dips or $0.80 peaks. Let’s get started.
Setting Up Bollinger Bands for Cardano
First, pick your platform. TradingView’s free and gold—load ADA/USD, click “Indicators,” type “Bollinger Bands,” hit enter. Default’s 20-day SMA, 2 standard deviations—stick with it for now. Binance’s charts work too: “Technical Indicators,” add Bollinger Bands, same settings. Crypto apps like Coinigy or TabTrader offer mobile setups—search “BBands,” apply to ADA.
Timeframe matters: 1-hour for day trades, 4-hour or daily for swings. Cardano’s 2025 average daily range is $0.05-$0.10, per CoinGecko, so adjust your zoom. Bands ready? You’re set to spot ADA’s moves.
How Bollinger Bands Signal Cardano Trades
Bands tell a story. ADA hugs the upper band—say, $0.82—it’s stretched, maybe time to sell. Drops to the lower band, like $0.68? Buy signal, if volume backs it. Tight bands mean a breakout’s brewing—$0.75 stuck for days, then boom, $0.90. Wide bands? Volatility’s high—think March 2025’s 15% ADA jump after a staking update.
Combine with price action: a bounce off the lower band with a green candle screams “buy.” Upper band rejection with a red wick? Sell or short. It’s not rocket science—it’s reading the rhythm.

Step-by-Step: Trading Cardano with Bollinger Bands
Let’s trade. On TradingView, ADA’s at $0.74, bands tightening—breakout alert. Set a buy at $0.76 if it crosses the middle band up, target $0.80 near the upper. Stop-loss at $0.72, below the lower band. Execute on Binance—0.1% fee, quick.
Next scenario: ADA’s $0.85, kissing the upper band, RSI at 70—overbought. Sell at $0.84, or short to $0.80 if you’re bold. Bands widen post-news (say, a Cardano summit)? Ride the wave, exit at $0.90. Practice on a demo first—real ADA’s your reward.
Fine-Tuning Your Bollinger Bands Strategy
Defaults work, but tweak for Cardano. 10-day SMA, 1.5 deviations catch shorter ADA swings—great for 15-minute charts. 50-day SMA, 2.5 deviations suit HODLers eyeing $1. Test it: backtrack ADA’s 2024 $0.60-$0.90 run on TradingView. Tight bands nailed the $0.65 buy, wide bands flagged the $0.88 sell.
Add filters: volume spikes (CoinGlass) confirm band signals. MACD crossover with a lower band touch? Double buy power. X posts—like @CharlesHoskinson’s updates—can tip you off. It’s your edge—sharpen it.
Best Platforms for Bollinger Bands on Cardano
TradingView’s top—free, customizable, ADA pairs galore. Binance’s built-in bands sync with trades—buy 100 ADA at $0.73, sell at $0.78, done. KuCoin’s lighter, mobile-friendly, same indicator. Coinigy’s $18/month pro tier adds alerts: “ADA hits lower band.” TabTrader’s free app tracks ADA on the go.
Pair with news—CoinSpectator flags Cardano upgrades. Free gets you far; paid unlocks speed. Pick your vibe—charts are your canvas.
Real Cardano Trades with Bollinger Bands
Meet Yuki in Osaka. January 2025, ADA at $0.70, lower band hit, bands tight. She bought 500 ADA, sold at $0.79 upper band—$45 profit. Or Miguel in Lisbon: $0.83, upper band rejection, shorted to $0.77, netted $30. Bollinger Bands don’t guess—they guide.
2025 Trends Boosting Cardano and Bollinger Bands
Cardano’s hot. Hydra scaling promises 1 million TPS—ADA could hit $1.20, per Messari. Staking’s up 20%—$0.05 ADA monthly for 100 staked. Volatility’s ripe: 2024’s 30% swings repeat in 2025, bands catching every dip. X buzz—#BollingerBands and #CardanoTrading spike pre-pumps.
Macro helps: BTC’s $90,000 run lifts ADA. Regs might cap it—SEC’s altcoin scrutiny looms. Bands thrive either way—volatility’s their fuel. Stay tuned, stay profitable.
Tips to Master Cardano and Bollinger Bands
Don’t chase every signal—lower band buys need volume. Tight bands, big news? Wait for the break. Pair with RSI—70+ at upper band, sell fast. Log trades—$0.72 to $0.80 twice? That’s your zone. Demo first—ADA’s real when you’re ready.
SEO hook: “Bollinger Bands Cardano 2025” or “trade ADA easy”? You’re here. Start simple, win big—your next ADA trade’s waiting.
Suggested Articles
For You
Related Articles
- Synthetic Assets: Tokenized Derivatives and Top Projects in 2025
- Pi Network Listing on Reputable Exchanges: A Game-Changer in 2025
- On-Chain Derivatives - Blockchain-Based Financial Contracts
- Scalping Strategies That Work for Bitcoin Traders: Mastering Crypto Profits in 2025
- How TradingView Transforms Your Crypto Trading Game in 2025
- How to Read Candlestick Charts for Better Trades: A 2025 Guide
- Why Stop-Loss Orders Save Your Crypto Investments in 2025
- How RSI Indicators Guide Your Bitcoin Buys in 2025
- Using MACD to Time Your Altcoin Trades Right in 2025
- How Fibonacci Retracement Boosts Your Trade Wins in 2025


